

No matter your business, measuring key performance indicators or KPIs is crucial to understanding and improving the effectiveness of your operation. KPIs break down your business performance into manageable pieces so you know where and how to make the critical adjustments necessary to achieve specific strategic goals.
That said, tracking most ideal variables and metrics will give the key data to make better-informed decisions. From revenue to conversions to return rates to order picking accuracy, knowing how to separate and interpret KPIs will undoubtedly help your online eCommerce store grow.
In this article, our goal is to help you and your team gain a deeper understanding of these KPIs and how they can be used to channel and achieve your strategic goals.
What are eCommerce KPIs?
Ecommerce KPIs, or key performance indicators, are the outcomes that track and evaluate the progress your eCommerce brand is making toward its vision of success. These quantifiable measurements or data points help gauge and break down the performance of more specific goals and objectives.
Why are KPIs important?
- Helps evaluate growth – KPIs provide an immediate snapshot of the overall performance of your company.
- Allows for real-time pivots – Understanding how to make performance-based adjustments in real-time can make or break your strategy.
- Offers data-driven analytics – Data-driven insights help make the most informed decisions to improve your online store.
- Emphasis on employee and customer relationships – KPI systems should reward and encourage customers to increase engagement.
- Increase online sales – The bottom line is that KPIs should tie back to tracking and growing online sales.
Ecommerce KPI indicators to track for your online store.
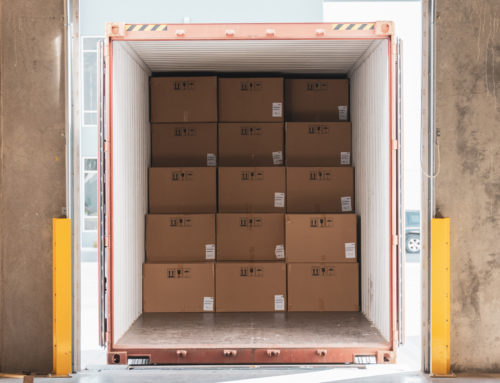
Shipping & Logistics KPIs
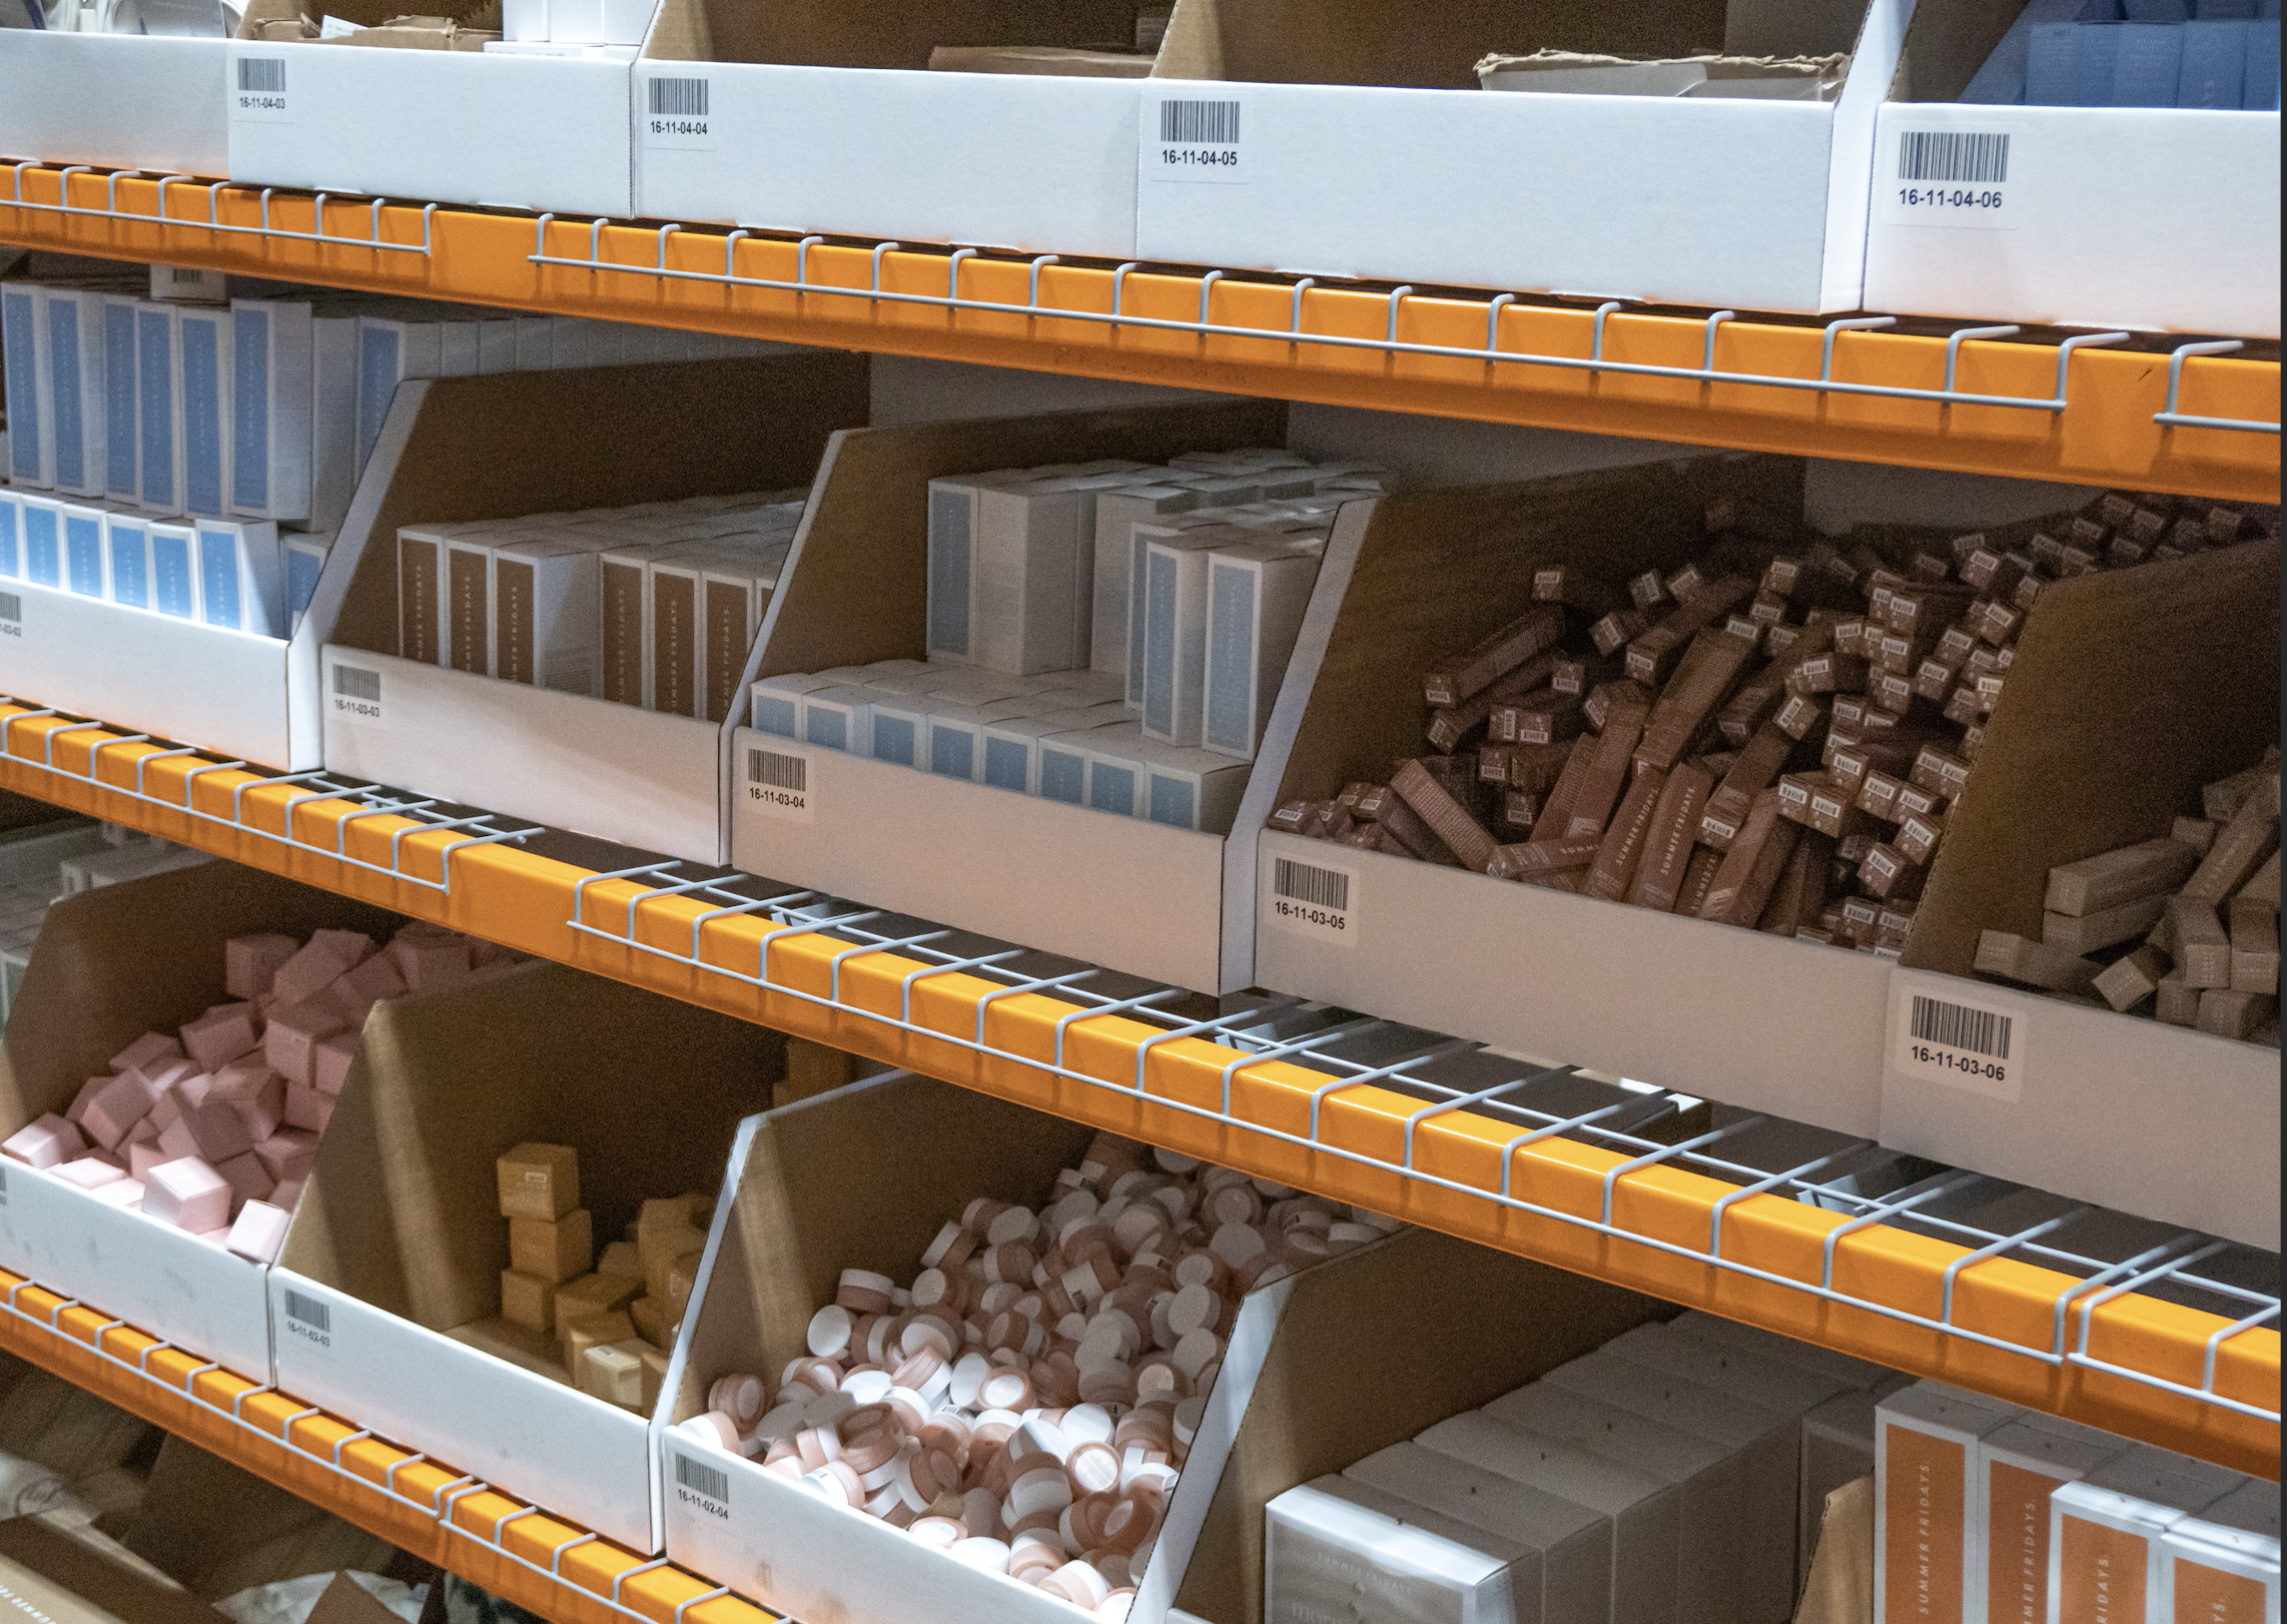
Inventory turnover rate
Inventory turnover rate measures how many times inventory is sold and then replaced in a specific period. Understanding your average inventory turnover by SKU is a decisive measure of product performance, as it relates to warehousing costs and sales. This rate can be measured and benchmarked against other companies in a given industry or the rest of your products, comparing faster sellers to slower ones.
The inventory turnover = costs of goods sold / Average inventory value
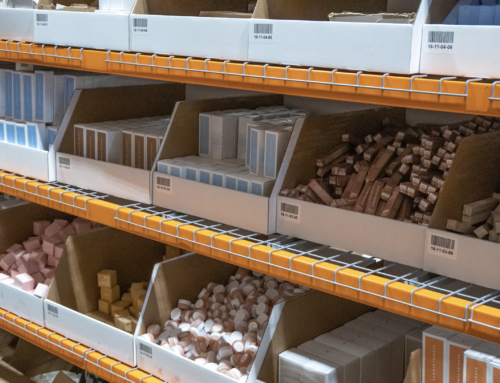
Inventory levels
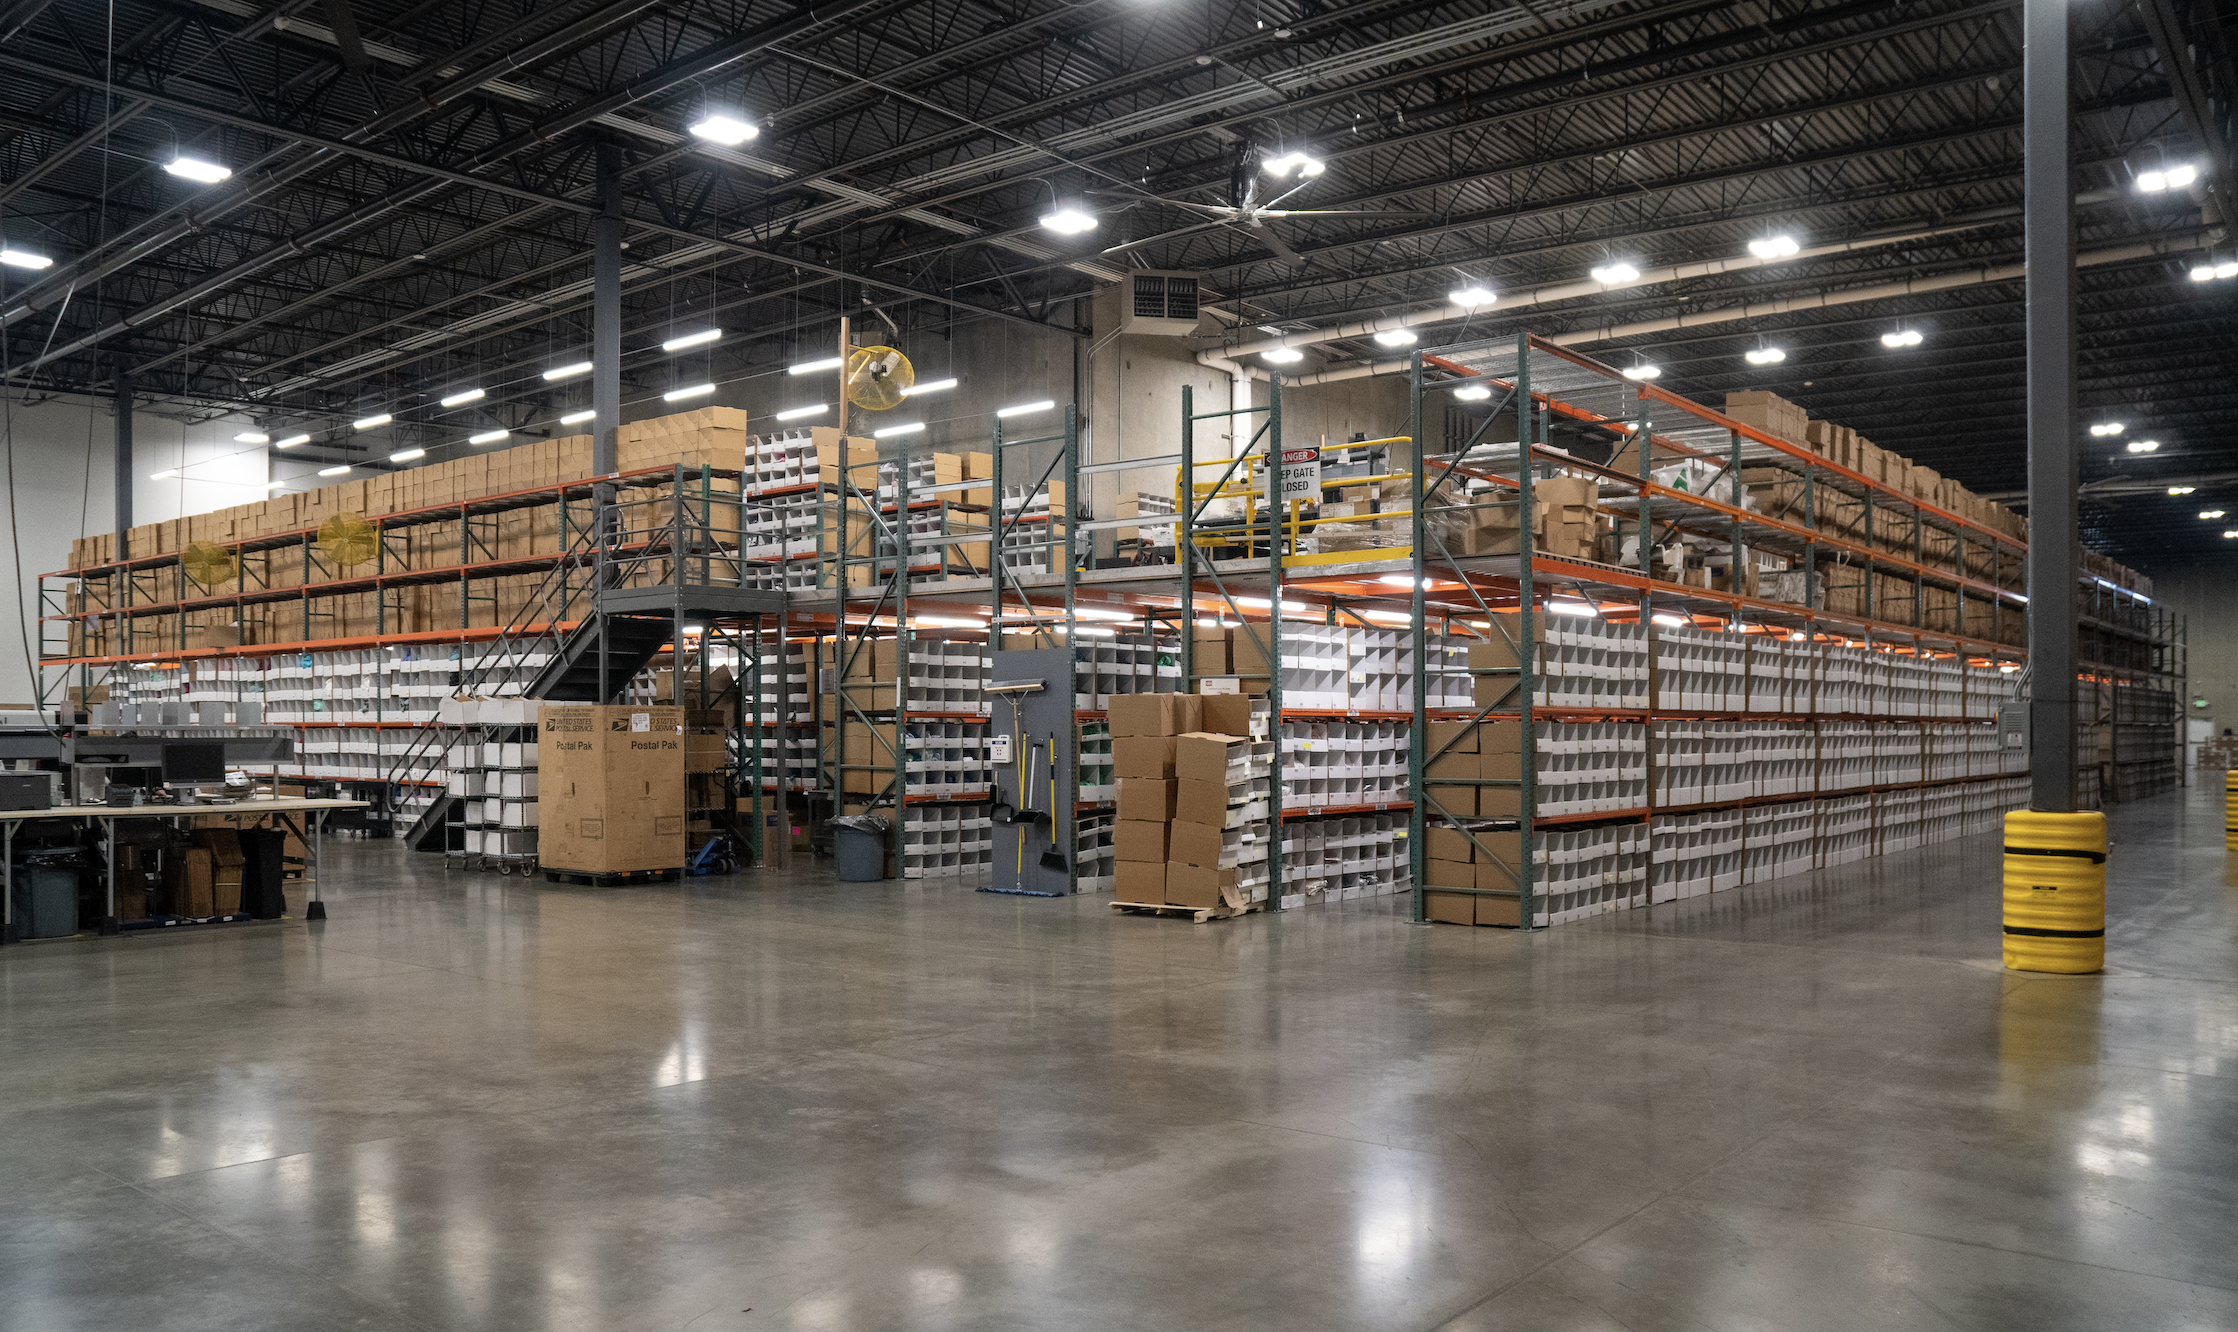
Inventory levels measure the amount of stock at hand and how quickly a particular product is selling. Real-time inventory tracking ensures that you have an accurate sense of how much product you have on hand, especially when orders and inventory are continually moving. Custom inventory management software like Driveline powered by Deposco ensures an accurate and transparent inventory monitoring system at every step of the process. Learn more here.
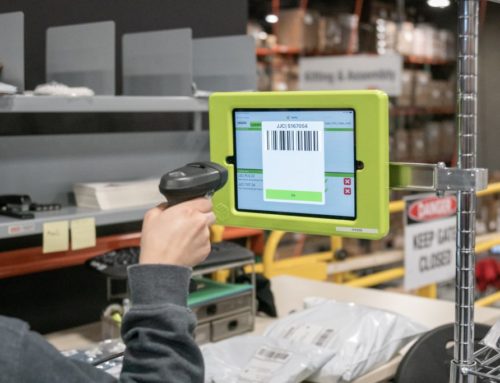
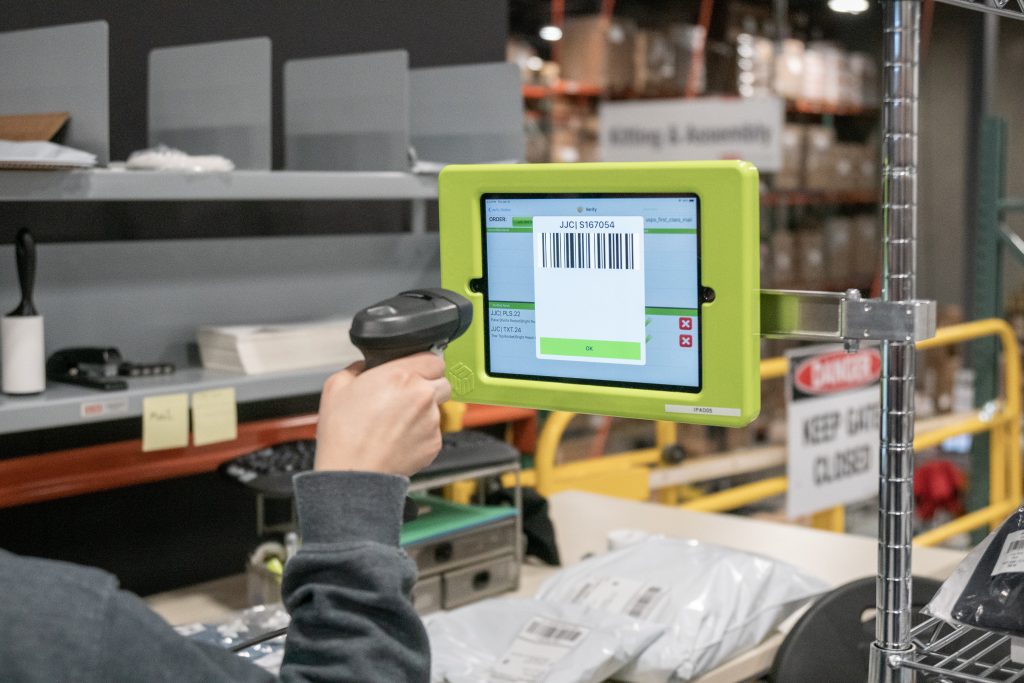
Order accuracy rate
The order accuracy rate is the percentage of all eCommerce orders that are fulfilled and shipped to the final destination without any issues, such as a miss-pack of an item or wrong unit quantity. Order accuracy is a vital metric to track because of its close tie to customer satisfaction and the way your brand is perceived.
Order accuracy rate = (Total # of accurate orders fulfilled / Total orders fulfilled) x 100
Time to ship
This metric simply refers to the amount of time it takes for an order to be shipped once it’s placed. Despite fluctuating inventory levels and production times, it’s crucial to stick to whatever shipping policy is guaranteed on your online store or policy.
Time to ship = Ship date – Date order was placed
Order volume
Order volume is a measurement of how many orders are placed in a set amount of time. Whether it be daily, weekly, monthly, quarterly, or annually, understanding the fluctuations in order volume helps you better understand how to fill the gaps and make up for lost sales.
Total # of orders = The sum of all orders placed within the timeframe
Return rate
This rate refers to the number of returns resulting from a purchased and shipped item. Do your best to have clear product descriptions, implement a defined return protocol, conduct regular product tests, and analyze return product trends to reduce the rate as a whole. If you can identify and investigate why certain products are returned more often than others, you can make the necessary improvements to resolve the issue. It could be anything from poorly padded or unprotected parcels to a manufacturer’s defect.
Return rate = The # of items returned / number of items sold
Average delivery days
Also known as the average transit time, average delivery days is the number of days it takes shipping carriers to deliver orders. It’s no secret that all customers want and expect the fastest possible delivery, so offering incentives like 2-day shipping and distributing inventory closer to end customers is never a bad idea.
Average delivery days = delivery days/total number of orders delivered
Percentage of on-time shipments
The total percentage of on-time shipments refers to the orders that are delivered without delay or within the expected timeframe. At times, the percentage can fluctuate out of your control due to carrier delays and demand.
On-time shipments ratio = (Number of shipments delivered on-time / Total shipments) x 100
Order picking accuracy
Closely tied to order accuracy rate, order picking accuracy takes packing and warehouse picking into consideration to calculate the total number of orders picked without error.
Order picking is one of the most important aspects of the eCommerce fulfillment process. As the foundation of the eCommerce fulfillment process, this metric directly impacts your brand’s reputation and customer relationships.
Customer Satisfaction KPIs
Customer satisfaction score (CSAT)
The customer satisfaction score is a metric that gauges how satisfied customers were with their online purchases. CSAT insights are normally calculated based on short-term consumer loyalty, asking customers to rate their shopping experience after checkout or shipment delivery.
CSAT = # of positive responses / Number of total responses x 100
The American Customer Satisfaction Index lists the industry-standard benchmarks for CSAT scores as:
- Apparel: 79
- Consumer Shipping 78
- Internet Retail: 80
- Specialty Retail Stores: 78
Net promoter score (NPS)
The net promoter score is an index score ranging from -100 to 100 measuring the willingness of customers to recommend your product or services to others. Internally these insights can guide a variety of strategic marketing decisions based on concrete customer insights and data. If you’re doing something right, it’s important to understand how to channel it.
Calculating NPS comes from emailing or asking customers a simple question like “On a scale of 0-10, how likely is it that you would recommend [your company name] to your friends, family, or business associates? (0 being not likely at all, and 10 being extremely likely)”
Separate the responses and decipher the different customer personas:
- Customers that give you a 6 or below are known as Detractors.
- A score of 7 or 8 are called Passives.
- A 9 or 10 are Promoters.
First response time (FRT)
First response times measures the amount of time that elapsed between when a customer submits a case or opens a ticket and when the response is received. Whether measured in minutes, hours, or days, the quickest response times always help customers feel heard and attended to.
FRT = Sum of first response times / Number of tickets
Customer resolution time (CRT)
Closely related to first response time, Customer resolution time is a metric that tells you on average how long it takes the eCommerce or customer support team to resolve issues.
CRT = Total resolution time / Total number of resolved requests.
Sales KPIs
Conversion rate
A conversion rate is the percentage of users that take action and commit to purchase or engage on site. Depending on your business objectives, a “conversion” can mean almost anything. From website browsers converting to subscribers or purchasers, moving users through the sales funnel starts with understanding the complexities and sensitivities of your conversion rate.
Conversion rate = Conversions / Total visitors ) x 100%
Cost of goods sold (COGS)
The cost of goods sold measures how much it costs to produce your products or services. COGS includes the direct labor and material expenses that go into producing each good and service your brand sells. Don’t include the following variables in calculating COGS:
- The cost of creating goods or services that you don’t sell
- Indirect expenses, like certain overhead costs
- Utilities
- Marketing expenses
- Shipping fees
Add the costs of direct labor and raw materials when solving for COGS.
COGS = Beginning inventory + Purchase during the period – Ending inventory
Customer acquisition cost (CAC)
Customer acquisition costs guide the resources necessary to attract new customers. Depending on your niche and marketing emphasis, tap into the most cost-effective and organic growth strategies. Explore social media marketing, PPC ads, SEO, email marketing, or other digital marketing strategies for the best results.
Using CAC can help determine profitability since it directly compares the amount of money spent to attract customers vs. the actual number of customers gained. As a benchmark, the average customer acquisition cost for consumer goods is $22
CAC = Total cost of sales and marketing / The number of new customers acquired
Churn rate
The churn rate calculates the speed at which customers are dropping your brand. Familiarizing yourself with churn rates is crucial to understanding what is and isn’t keeping customers around. If a typical customer doesn’t stick around long enough to make up for the acquisition cost, you may want to reevaluate.
Churn rate = (Lost customers / Acquired customers)
Average order value
Average order value tracks the average dollar amount spent each time a customer places an order on your website. AOV is integral to your eCommerce pricing strategy and online marketing efforts because these metrics help measure an individual’s long-term value.
AOV = Revenue / Number of orders
Marketing KPIs
Site traffic
Website traffic refers to the number of visits you receive to your online store. Measuring site traffic is an accepted method to gauge the effectiveness of attracting an audience. Website traffic flow can be traced to several sources including organic searches, clicks from social media, affiliates, direct traffic, and other channels.
Return on ad spend (ROAS)
Return on ad spend refers to the amount of revenue your business earns for each dollar it spends on advertising. The more effective the ad campaign, the more revenue comes for each dollar spent.
Bounce rate
A Bounce Rate is an analytics expression used to describe a single-page or non-interactive website visit, defined as a percentage. A bounce is when a user visits a website from google or another channel, browses only one page, fails to interact, then leaves
Social media engagement
Social media metrics involve the number of people interacting with your brand on social media platforms. There are countless benefits of using social media to leverage your brand and online store. Diving deeper into social media analytics can help you track and increase your followers, impressions, and reach. The native management tools and built-in analytical features on social platforms can provide a wealth of information in analyzing metrics.
Shopping cart abandonment
Shopping cart abandonment rate is an eCommerce term used to describe the visitors adding items to an online shopping cart who exit without completing the purchase. Shoppers abandon items in a cart for many reasons that commonly include hidden fees, complicated checkout processes, and extra shipping fees.
How Drive Fulfillment can make these key performance indicators a reality?
At Drive Fulfillment, we understand what it takes to gain a competitive advantage in the eCommerce world. While there are several important key performance indicators to monitor, leave the logistical complexities and supply chain work to us. With 10+ years of fulfillment expertise and a variety of services including multi-channel eCommerce fulfillment, kitting and assembly, custom packaging, on-demand, and direct-to-garment (DTG) printing, we’ve got you covered. Explore our facilities, portfolio of work, and potential growth opportunities for you by getting in touch today.

